
Physical assets like gas storages, oil transportation facilities or power plants, are intrinsically exposed to market price risk. For instance, a gas storage is a facility to capitalize calendar arbitrage, since it allows to carry lower-cost gas from the summer period to the more expensive winter period. This makes the value of a gas storage dependent on the winter/summer spread of the gas price and its dynamics (volatility) over time.
Trader and portfolio manager of physical assets are confronted with two main types of tasks:
- Elimination of price risk, i.e. hedging the storage value against changes in the winter/summer spread price.
- Optimal operation of the asset, i.e. finding the optimal injection and withdrawal actions during the operation period.
Additionally, the tasks above complicate by the fact, that commodity markets tend to be less liquid than financial markets.
Storage Management
Consider a gas storage that operates over a gas year going from the 1st of April 2018 to the 1st of April 2019. It is assumed that the storage is empty at start, and the action to inject or withdraw gas is decided on a daily basis. Furthermore, it takes 100 days to fully inject, and about 33 days to fully withdraw the storage’s volume.
The example here focuses on the price risk management for a six months period before the operation of the storage starts for the gas year 2018/2019. Hedging the price risk during the operation period is advisable too, but also more involved, since hedge contracts expire continuously and must be therefore rolled into succeeding contract.
The price risk can be visualized by comparing the daily gas forward curve at the beginning of the hedge period (red curve in plots below), here 1st of October 2017, with the curve at the beginning of the storage operation period on 1st of April 2018 (blue curves).
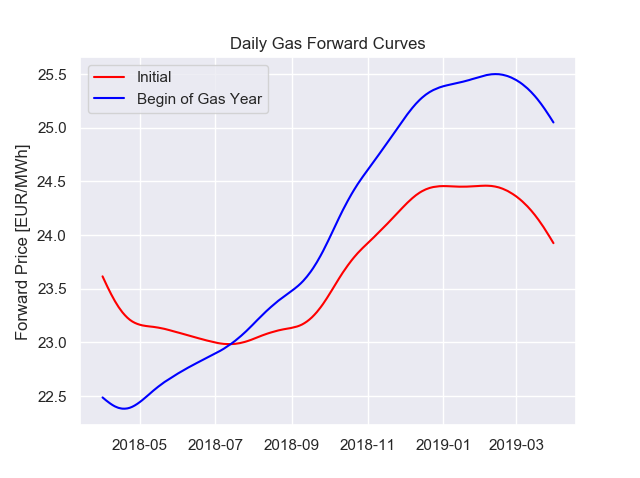
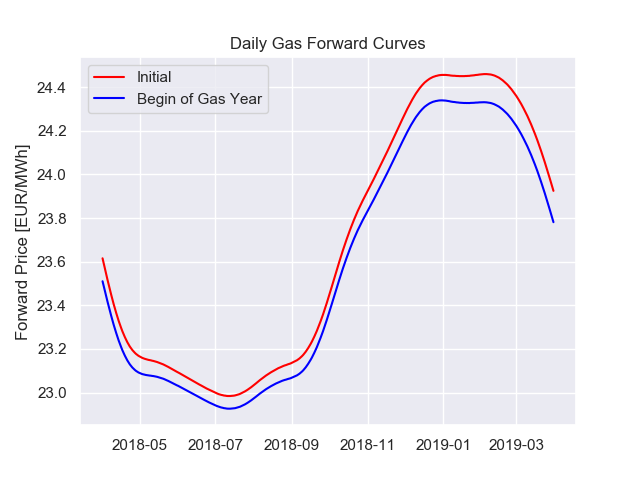
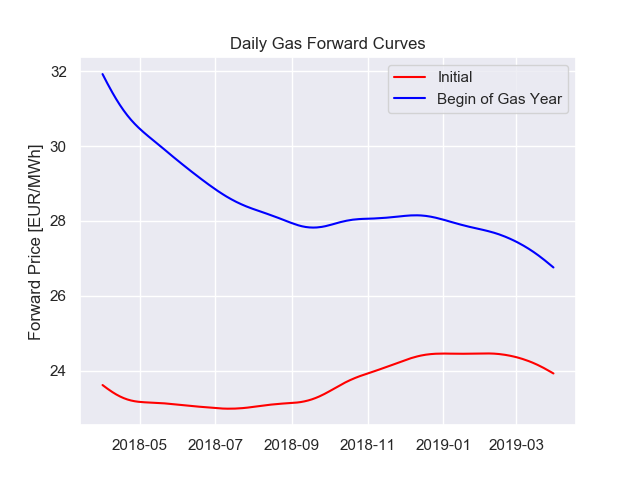
Three different evolutions of daily gas forward prices.
In the left case the winter/summer spread (WS-spread) increased, in the middle case it stayed nearly constant, and in the right case the WS-spread decreased, became even negative.
The effect of varying forward prices to the optimal gas storage operation is reflected in the next graphs, showing the optimal dispatch corresponding to each of the forward curves above. The optimal intrinsic dispatch for given prices is the particular daily schedule for injection (buying) or withdrawing (selling) gas, that maximizes the cumulated cashflows resulting from these actions.
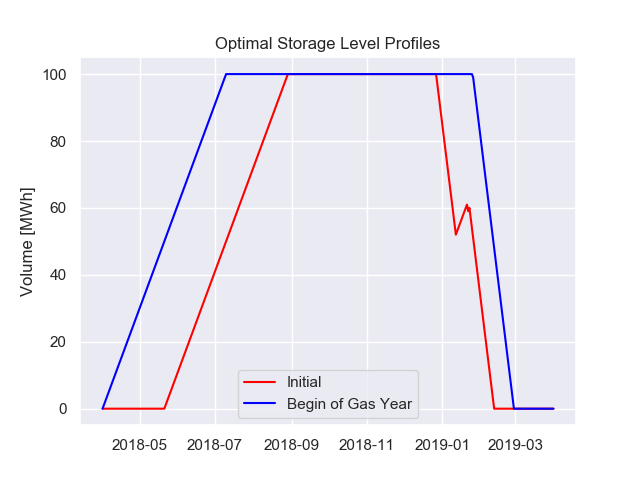
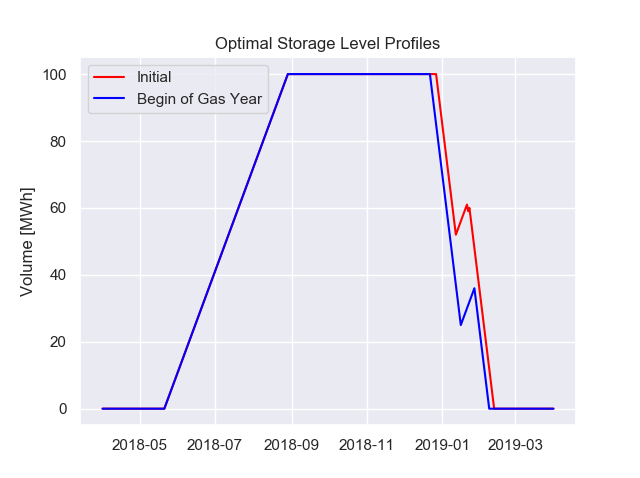
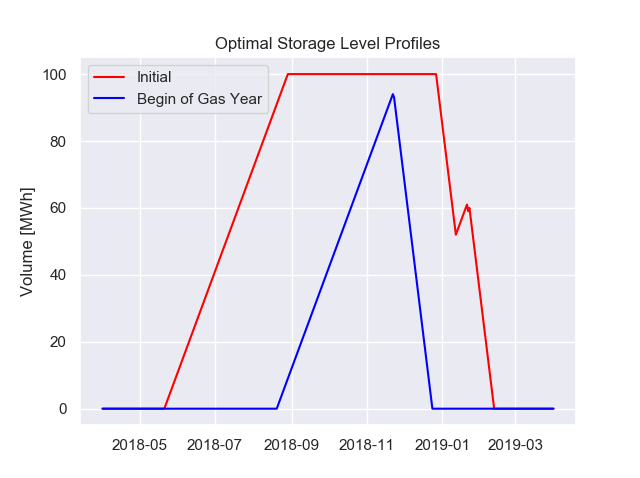
Optimal gas storage dispatches corresponding to the forward curve evolutions above.
The red line shows the optimal dispatch – in terms of the storage volume level – for the initial forward curve. Accordingly, the blue lines are the optimal storage dispatches corresponding to the three different forward curve variations above.
The intrinsic value of the storage is then given by the cumulated cashflows resulting from operating the storage according to the dispatch schedule. The value of the storage on 1st of April 2018 for the given cases is shown in the table below, relative to the initial storage value on 1st of October 2017.

This clearly demonstrates the need of hedging the price risk of physical assets.
Risk Management
Daily gas forwards as shown above are not traded instruments on the gas markets, but important for a realistic valuation of a gas storage. Tradable instruments are typically swap instruments with tenors covering the gas year, the summer and winter period, or the next quarters and months.
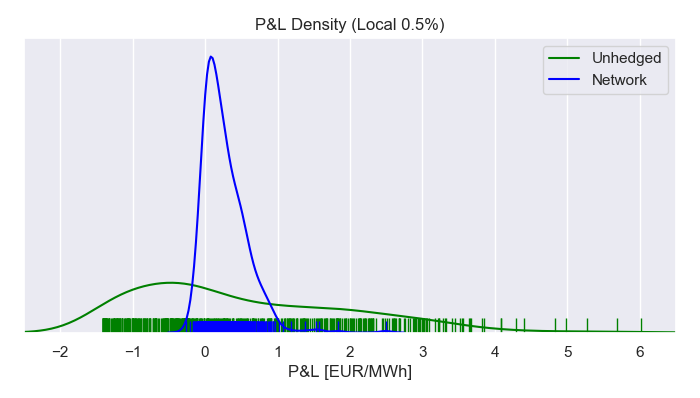
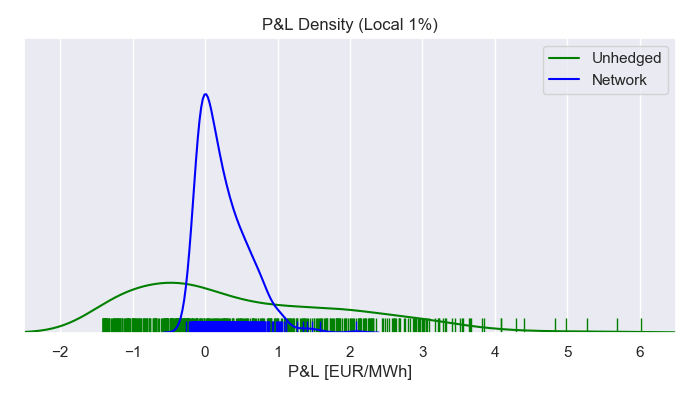
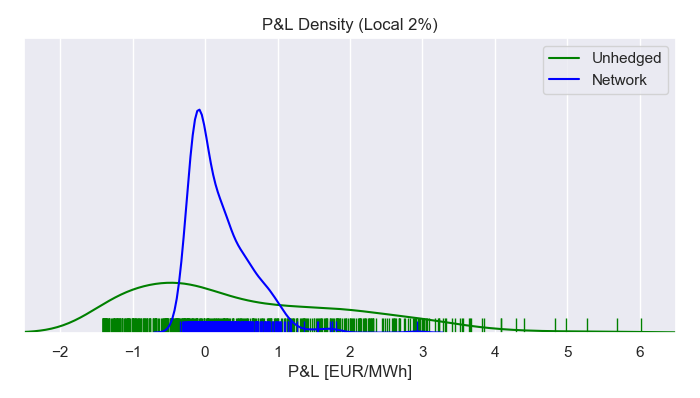
The P&L (profit and loss) distributions below show the results of hedging the gas storage during the period using the summer 2018 and winter 2018/19 swap. Three cases with 0.5%, 1% and 2% transaction costs relative to the gas price are considered. The hedge positions are determined by a Recurrent Neural Network model, that is trained to minimize the 90% expected shortfall of the P&L.
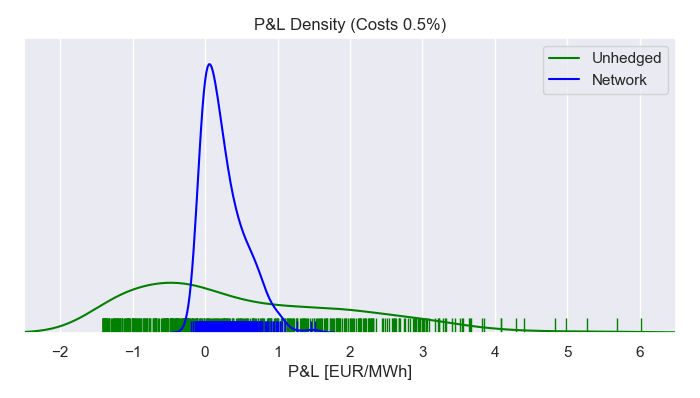
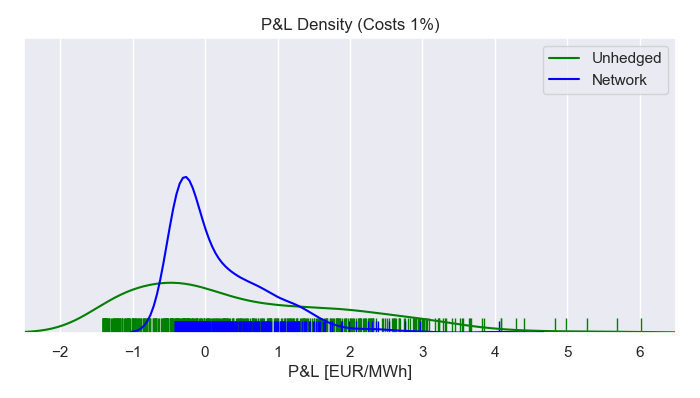
P&L densities from hedging with local market instruments for 0.5% (top left), 1% (top right) and 2% (bottom) transaction costs.
When transaction costs are relatively small (left figure), the Neural Network hedger is able to minimize the expected shortfall quite well, compared to leaving the gas storage unhedged. The larger the transaction costs become, the more the P&L density of the Neural Network hedger approaches the shape of the unhedged density. In these situations, the hedger reduces the hedge quantities due to the costs, and so generates a hedge portfolio that gets closer to a completely unhedged one.
Proxy Hedging
Unfortunately, many gas storages are located in areas with where gas markets have low liquidity and transaction costs of 2% or more. On the other hand, the prices of low-liquidity markets often follow a reference market price (a hub price) traded with a premium. If a reference market exists, a substantial part of the local price risk can be eliminated by proxy hedging using the reference swap instruments.
Assume that additionally to the local market a reference market exists, having 0.5% transaction costs. The prices of the local market are linked to the prices of the reference market, but bear a basis risk that cannot be hedged using reference market products only.
The Neural Network hedger is allowed to trade in hedge products from the local and the reference market.
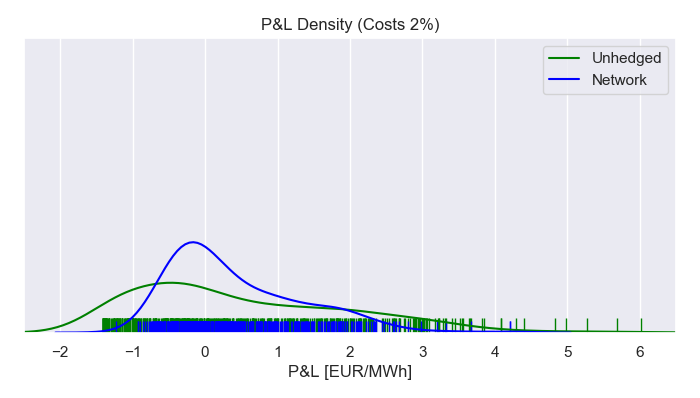
Comparing again the three cases above with 0.5%, 1% and 2% transaction costs for the local market (the reference market trades in all cases with 0.5% costs), the P&L distributions now show much less deviation when transaction costs are high on the local market.
P&L densities from hedging with local and reference market instruments for 0.5% (top left), 1% (top right) and 2% (bottom) transaction costs.
The higher the transaction costs on the local market, the more the Neural Network hedger places hedge positions on the reference market. However, since some local price risk cannot be proxy hedged, hence is left unhedged in the case of high transaction costs, the distribution slightly widens in that case (right figure).
If you are interested in learning more about the potential of hedging and optimizing physical assets, or if you are looking for an individual solution for your business, please contact us.